
Document Type : Research Article (Regular Paper)
Authors
Department of Animal Science, Faculty of Agriculture, Tarbiat Modares University, Tehran, Iran.
Abstract
Keywords
Main Subjects
Introduction
Domestic dog (Canis familiaris) belongs to the order Carnivora, and is originated from their carnivorous ancestors and probably gray wolf in the past (Bannasch et al., 2005). The dog has been one of the companions of human from ancient time until now and has been used for various purposes such as guarding and hunting. Over thousands of years, the species has evolved into different breeds with various behavioral and physiological characteristics (Parker et al., 2004). Breeding of the domestic dog provides an unparalleled opportunity to explore the genetic diseases as well as morphological variations and behavioral characters. The position of the dog within the mammalian evolutionary tree also makes it an important guide for comparative analysis of the human genome (Lindblad et al., 2005).
From animal breeders' standpoint, the knowledge of the genetic structure of populations can be of great help to preserve genetic resources (Kukekova et al., 2009). It has been shown that genetic diversity of animals is useful in population and its lack or shortage reduces the strength of future selections. Therefore, the knowledge of genetic diversity is important for reformers to maintain the genetic resources and develop the genetic strategies for next generations (Jack and Felix, 1996). Furthermore, it would be helpful to reduce the risk of reduction of the animals in nature and prevent their extinction, creating the opportunity for oncoming new markets and use the native gene pool for saving the quantitative or qualitative and fitness related traits in a population. Reduction of the genetic diversity enhances the risk of inbreeding in which consequently pave the way to fix some specific alleles within a breed and then result in increasing the hereditary defects in the population (Kang et al., 2009).
The domestic dog shows great variations in morphology and behavior which make it an interesting subjects for scientific studies (Kukekova et al., 2009). In recent years, various studies have been designed by genetic markers that have helped in separating the species and could be used in breed preservation programs. Moreover, these markers are useful in determining the genetic diversity between or within populations (Lindblad et al., 2005). The most available and efficient markers, microsatellite markers, have been developed and are being used in population diversity and conservation studies or mapping the canine genome (Parker et al., 2004; Kang et al., 2009).
In addition to autosomal markers which are able to show genetic diversity in different populations (Bannasch et al., 2005), the application of Y chromosome markers also can be used to determine the paternal lineages and male diversity within or between populations. Because male and female animals do not play the same role in population structure, this asymmetry between the sexes affect the breeding strategies (Greenwood, 1980). The effect of male offspring on inbreeding is greater than that of the females, therefore, male animals have a significant role in creating pure samples in the population, which decreases the variation among animals. Low variation within the population leads to inbreeding depression. Since the Y chromosome is passed only through male animal to the next generation and it shows low recombination, the study of this chromosome is useful to follow the derivation of origin of the sire lineage of animals. The results could be applied in designing the mating systems to increase the variation within or between populations.
Few studies on Y chromosome, using a specific regional sequence or specific microsatellite markers, have been carried out to uncover the genetic structure and paternity lineages of animals (Sundqvist et al., 2001; Bannasch et al., 2005; Ding et al., 2012). Moreover, the Y-chromosome markers in combination with autosomal chromosomes have been used for better understanding of the dog-wolf genetic analysis and hybridization (Iacolina et al., 2010).
Archeological findings have indicated the presence of dogs in Iran as early as 6000 BC (Dadvar and Khosravifar, 2012). Dog rearing in Iran has been strongly influenced by the environments within which they have been raised, from the rough terrain and hilly regions in the northwest to dry and harsh conditions in the south or east. This has resulted in the development of discrete populations of dogs with distinct genetic characteristics such as herding, guarding and hunting. Iranian native dog populations could be divided to several ecotypes, according to physical appearance and habitats.
In spite of the presence of a range of diverse indigenous dog ecotypes in Iran, genetic studies on dogs are not well established. Therefore, the current study was recommended by the Research Center of Antinarcotic Police of Iran to analyze the genetic structure, variation, distance and the paternal origin and diversity between Iranian native dog populations. The findings could be applied not only for understanding the structure and relatedness of the animals, but for designing the breeding strategies to protect the effective size of the populations.
Materials and methods
Sample collection
A total of 97 blood samples were collected randomly from 5 dog ecotypes, namely, Sarabi (n=20), Kurdish (n=12), Bakhtiari (n=15), Tazi (Saluki) (n=8) and Sangsari (n=6), and 3 free populations of Western part (n=11), Khorasan (n=10) and Alborz (n=15). These populations are distributed across various parts of Iran. The Tazi (Saluki) ecotypes were widespread along the Silk Route from east to west and were used as good hunters due to its high flexibility and quickness in running. The Sarabi ecotype is considered one of the oldest and powerful indigenous dogs in Iran which is used for guarding and fighting. These two dogs are native of East Azerbaijan province. Kurdish dog is a large- ecotype originating from the West Azarbaijan., Kurdestan and Kermanshah provinces. Other Iranian dog ecotypes, including the Bakhtiari and Sangsari, are commonly used for herding.
DNA extraction and microsatellite markers
The DNA was extracted using the phenol-chloroform method (Paabo et al., 2004). A total of 17 microsatellite markers, including 13 autosomal markers and 4 Y-chromosome-specific markers, from unconserved genome, were used in this study (Table 1). Microsatellite markers were chosen on the basis of polymorphic information content (PIC) and heterozygosis values reported in earlier studies (Richman et al., 2001; Guyon et al., 2003; Breen et al., 2001; Mellersh et al., 2000; Bannasch et al., 2005; Olivier et al., 1999). The PCR reaction was accomplished in a total volume of 15 µL using 30 ng of genomic DNA, 2 mM MgCl2, 2.5 mM dNTPs, 1.5 µL PCR buffer (10x), 10 ρmol of each primer and 1 µL of Taq polymerase. The amplifications were carried out using a denaturation at 95ºC for 5 min followed by 35 cycles of denaturation at 95ºC for 30 s, annealing (44-60ºC) for 30 s, extension at 72ºC for 30 s and a final extension for 5 min at 72ºC. Then, 7 µL of amplified product was mixed with 4 volumes of formamide loading dye and denatured at 95ºC for 5 min and separated on a 6% polyacrylamid gel for 14 h. The gels were silver stained and the bands were visually observed on the gels. The discrimination of the microsatellite alleles was determined by comparison with an adjacent DNA ladder.
Table 1. Information on microsatellite markers used in this study
|
Marker |
Forward Primer 5`→3` |
Reverse Primer 3`→5` |
Annealing Temperature (0C) |
Cho. N. |
Reference |
|
C26.73320 |
CCCTCTACTTATGTCTCGGCC |
GAGAGGAGAAACAACCAACACC |
56 |
26 |
Richman et al., 2001 |
|
CXX.6727,10,18 |
AGGTCAGGGACAATATACCGT |
CCTGAGCCCAAGGCAGAC |
56 |
23 |
Richman et al., 2001 |
|
FH20609,20 |
GTTTTGAGGAAGCCTTGCTG |
GAAGGAAGGGGCCAGTATTC |
58 |
8 |
Richman et al., 2001 |
|
FH20169, 20 |
CATTTTTAAGGATGGAGACAGC |
AACAGTGTCCCATGGCCTAC |
57 |
1 |
Richman et al., 2001 |
|
FH2790 |
AGGCCTTCTCTGTCCTCTTG |
CCAATATTGTTAAGAAGTTCAAC |
57 |
33 |
Guyon et al., 2003 |
|
FH2914 |
GTGATCCACTTGCTTGTATCC |
ATAGCCTTGGGAATTTTTGC |
56 |
21 |
Guyon et al., 2003 |
|
FH3053 |
GATTAAAAGGGCAAGCAACC |
TCATCTCCAGCTTTTCATGG |
54 |
30 |
Guyon et al., 2003 |
|
FH2795 |
TGTGAGTAGGGTAGGGCAGG |
GGCTGGACTTTTGTCATTTG |
56 |
18 |
Guyon et al., 2003 |
|
REN86G15 |
CAACTAAGGCAGAGAATACCA |
CAGCGAATTTGGGCACTAA |
56 |
38 |
Breen et al., 2001 |
|
REN144M10 |
TCTCATGCAAATCTTCGTTCA |
GCCACCTCATTCCAAAAAGA |
53 |
15 |
Breen et al., 2001 |
|
REN87O21 |
TGGCTGTGGCTAAGGCTTTGT |
CCCCTTCAGCTTCGGTGTAG |
57 |
26 |
Breen et al., 2001 |
|
REN126A15 |
CTACAGGGCAGTTCCACTCTT |
AAAGGGATTCAGGGAGGTTTG |
57 |
9 |
Breen et al., 2001 |
|
REN59H07 |
AGGCACTTATCGCTCTCAT |
TTGTTTTTCCATCATTTTT |
46 |
4 |
Mellersh et al., 2000 |
|
650-79-2 |
ACTCAGCTCTCCCTTGTCCA |
TTGAGGGCAGGTCTCAGAGT |
60 |
Y |
Bannasch et al., 2005 |
|
650-79-3 |
AGTTTCTGCCCAGGAAGGAC |
AGCTGAGCGGTTTGAAACTT |
60 |
Y |
Bannasch et al., 2005 |
|
SRY |
GAACGCATTCTTGGTGTGGTCTC |
GGCCATTTTTCGGCTTCTGTAAG |
60 |
Y |
- |
|
AF192268 |
GCCCTGGAAGTGTATATTCCTCTAA |
TCTGAAGCTTCTTGTTATGTGTCAG |
60 |
Y |
Olivier et al., 1999 |
Statistical analysis
The size of alleles, allele types and kind of genotypes were determined by the Excel software. The Pop-Gene1.31 Software was used for estimation of the Hardy–Weinberg equilibrium and diversity criteria such as, allele frequencies, the mean number of alleles per locus, observed heterozygosis (Ho), expected heterozygosis (He), and Shannon index for each locus (Yeh et al., 1999). The Shannon index criterion is very useful for the measurement of genetic diversity of the loci that have high polymorphism, like microsatellite markers (Alipor et al., 2013). The PIC was calculated by the Het Software (Ott, 1992).
The genetic relationships among Iranian native dogs were analyzed using two different approaches based on allele frequencies at microsatellite loci: first, pair-wise FST was used to establish genetic distances among the breeds under genetic drift, which is the main factor promoting genetic differentiation between the breeds; second, the genetic distance between the breeds was calculated according to Nei’s genetic distance (Nei, 1972). The former was analyzed using GeneAlex 6.5 (Peakal and Smouse, 2006), and the latter was calculated by Pop-Gene32 Software (Yeh et al., 1999). Phylogenetic trees were constructed using neighbor-joining (NJ) clustering (Nei, 1972) from Nei’s distance method.
The number of Y-chromosome microsatellite haplotypes in different populations were used as a measure of genetic diversity. Because mutations in microsatellite loci are normally produced by the addition or deletion of one or two repeat units (Ellegren, 2004), two haplotypes that differ at multiple microsatellite loci or by multiple repeat units are not likely to have recently been derived from each other. Haplotypes were constructed based on the presence of alleles for the four Y-chromosome microsatellites, and allele and haplotype diversity were calculated using Arlequin 3 software (Excoffier et al., 2007).
Results
Genetic diversity in Iranian native dogs
The allele and genotype frequencies of 13 microsatellite loci were determined in 8 Iranian native dog populations. Some characters of the microsatellite loci in all animals are shown in Table 2. All microsatellite markers used in the current study showed polymorphism, except the FH20169,20. Although some unique alleles were found in certain populations, these are unlikely to be useful as population specific markers due to their low frequency in the populations.
Seventy six alleles were identified across the 13 microsatellite markers. The total number of alleles per locus varied from 4 (FH3053) to 9 (FH20609,20). The average allele number of polymorphic loci was 6.2 allele per locus. The highest and the lowest effective alleles ranged from 5.93 (FH20609,20) to 2.44 (FH3053) among the populations. The heterozygosity was used to investigate the diversity and effectiveness of genetic marker. The highest rate of intended heterozygosity was related to FH20609, 20 locus (0.83) and the lowest to FH3053 locus (0.59). The highest and lowest Shannon indexes were observed in FH20609,20 locus (1.81) and FH3053 locus (1.06), respectively. These values seem quite reasonable in comparison to the allele numbers of these two loci.
Table 2. The criteria diversity of all animals
|
Loci |
No. of Alleles |
No. of effective alleles |
Shannon Index |
PIC |
FIS |
FIT |
FST |
He |
Ho* |
|
C26.73320 |
7 |
3.72 |
1.41 |
0.70 |
0.49 |
0.63 |
0.23 |
0.73 |
0.24 |
|
CXX.6727,10,18, |
5 |
3.34 |
1.32 |
0.63 |
0.58 |
0.64 |
0.16 |
0.71 |
0.24 |
|
FH20609,20 |
9 |
5.93 |
1.81 |
0.83 |
0.46 |
0.59 |
0.18 |
0.83 |
0.32 |
|
FH2790 |
6 |
4.78 |
1.65 |
0.75 |
0.29 |
0.43 |
0.16 |
0.79 |
0.45 |
|
FH2795 |
6 |
3.23 |
1.42 |
0.61 |
0.68 |
0.72 |
0.09 |
0.69 |
0.19 |
|
FH2914 |
5 |
4.38 |
1.53 |
0.68 |
0.57 |
0.68 |
0.14 |
0.77 |
0.24 |
|
FH3053 |
4 |
2.44 |
1.06 |
0.46 |
0.30 |
0.41 |
0.15 |
0.59 |
0.30 |
|
REN59H07 |
6 |
4.34 |
1.50 |
0.63 |
0.58 |
0.65 |
0.18 |
0.77 |
0.27 |
|
REN87O21 |
5 |
3.38 |
1.33 |
0.61 |
0.91 |
0.93 |
0.21 |
0.70 |
0.05 |
|
REN126A15 |
8 |
4.50 |
1.62 |
0.79 |
0.54 |
0.59 |
0.09 |
0.78 |
0.29 |
|
REN144M10 |
7 |
5.14 |
1.72 |
0.77 |
0.48 |
0.56 |
0.12 |
0.80 |
0.36 |
|
REN86G15 |
8 |
4.94 |
1.7 |
0.79 |
0.40 |
0.52 |
0.14 |
0.80 |
0.32 |
|
Mean |
6.2 |
4.4 |
1.5 |
0.68 |
0.52 |
0.61 |
0.15 |
0.73 |
0.27 |
* All breeds examined, PIC: Polymorphic Information Content, He: Expected Heterozygosity, Ho: Observation Heterozygosity
The FST value for each locus is very close and levels of apparent breed differentiation were considerable (Table 2). Multi locus FST values indicated that approximately 15% of the total genetic variation was explained by breed differences, with the remaining 85% corresponding to differences among individuals. On the average, breeds had a 5.2% deficit of heterozygotes, whereas the total population had a 61% deficit of heterozygotes.
All populations, except the Bakhtiari, Sarabi and the Alborz samples, showed a significant deviation from HWE at more than one locus (Table 3). Out of 96 cases (8 populations, 12 loci), 14 loci (locus FH20609, 20 in Sarabi, loci FH3053 and FH2914 in Western area,, loci FH3053 and C26.73320 in Khorasan, loci FH3053 and FH20609,20 in Tazi (Saluki), loci FH3053 and CXX.6727,10,18 in Kurdish, loci REN86G15, REN144M10 and REN59H07 in Sangsari, locus FH2790 in Alborz and locus FH3053 in Bakhtiari populations) showed significant deviations from HWE (P
Table 3. Sample size, allele diversity (the mean number of observed alleles per locus), observed heterozygosity (Ho), expected heterozygosity (He) and P values of Iranian dog populations across all loci
|
Populations |
Sample Size |
Allele Diversity |
Ho |
He |
P-val. (No. of Loci)a |
|
Tazi (Saluki) |
8 |
3.8 |
0.36 |
0.64 |
0.084 (2) |
|
Khorasan samples |
10 |
3.5 |
0.30 |
0.56 |
0.040 (2) |
|
Sangsari |
6 |
3.0 |
0.26 |
0.53 |
0.010 (3) |
|
Kurdish |
12 |
5.1 |
0.29 |
0.72 |
0.081 (2) |
|
Western part samples |
11 |
3.4 |
0.27 |
0.61 |
0.032 (2) |
|
Bakhtiari |
15 |
4.5 |
0.23 |
0.66 |
0.031 (1) |
|
Sarabi |
20 |
4.5 |
0.28 |
0.68 |
0.025 (1) |
|
Alborz samples |
15 |
4.0 |
0.25 |
0.59 |
0.038 (1) |
|
Average |
12.1 |
3.9 |
0.28 |
0.62 |
0.042 (14) |
aNumber of locus showing departure from Hardy–Weinberg equilibrium.
Genetic relationships among the Iranian native dogs
Table 4 shows the Nei’s genetic distance, FST, and Nm values when were are considered in couples. Across the 12 loci, the mean genetic differentiation values (FST) ranged from 0.04 for the paired population of Sarabi-Bakhtiari to 0.15 for the Tazi (Saluki)-Alborz. The number of migrants per generation (Nm) varied from 1.5 for the Tazi (Saluki)-Alborz to 5.17 for the Sarabi-Bakhtiari paired populations, indicating high gene flow between the Sarabi and Bakhtiari dogs (Table 4). It should be noted that the gene flow among the Khorasan dogs seems to be relatively high in comparison to the other dog populations. When genetic data are obtained from several populations to investigate genetic similarity, genetic distance matrix is used. The smallest geneticdistance (0.31) was observed between the Sarabi and Bakhtiari populations, and the largest (0.85) was detected between the Tazi (Saluki) and Alborz samples (Figure 1; Table 4). The Alborz population showed the highest levels of between-population divergence (FST= 0.06 to 0.15 and Nei’s distance= 0.37 to 0.85) in comparison to other populations.
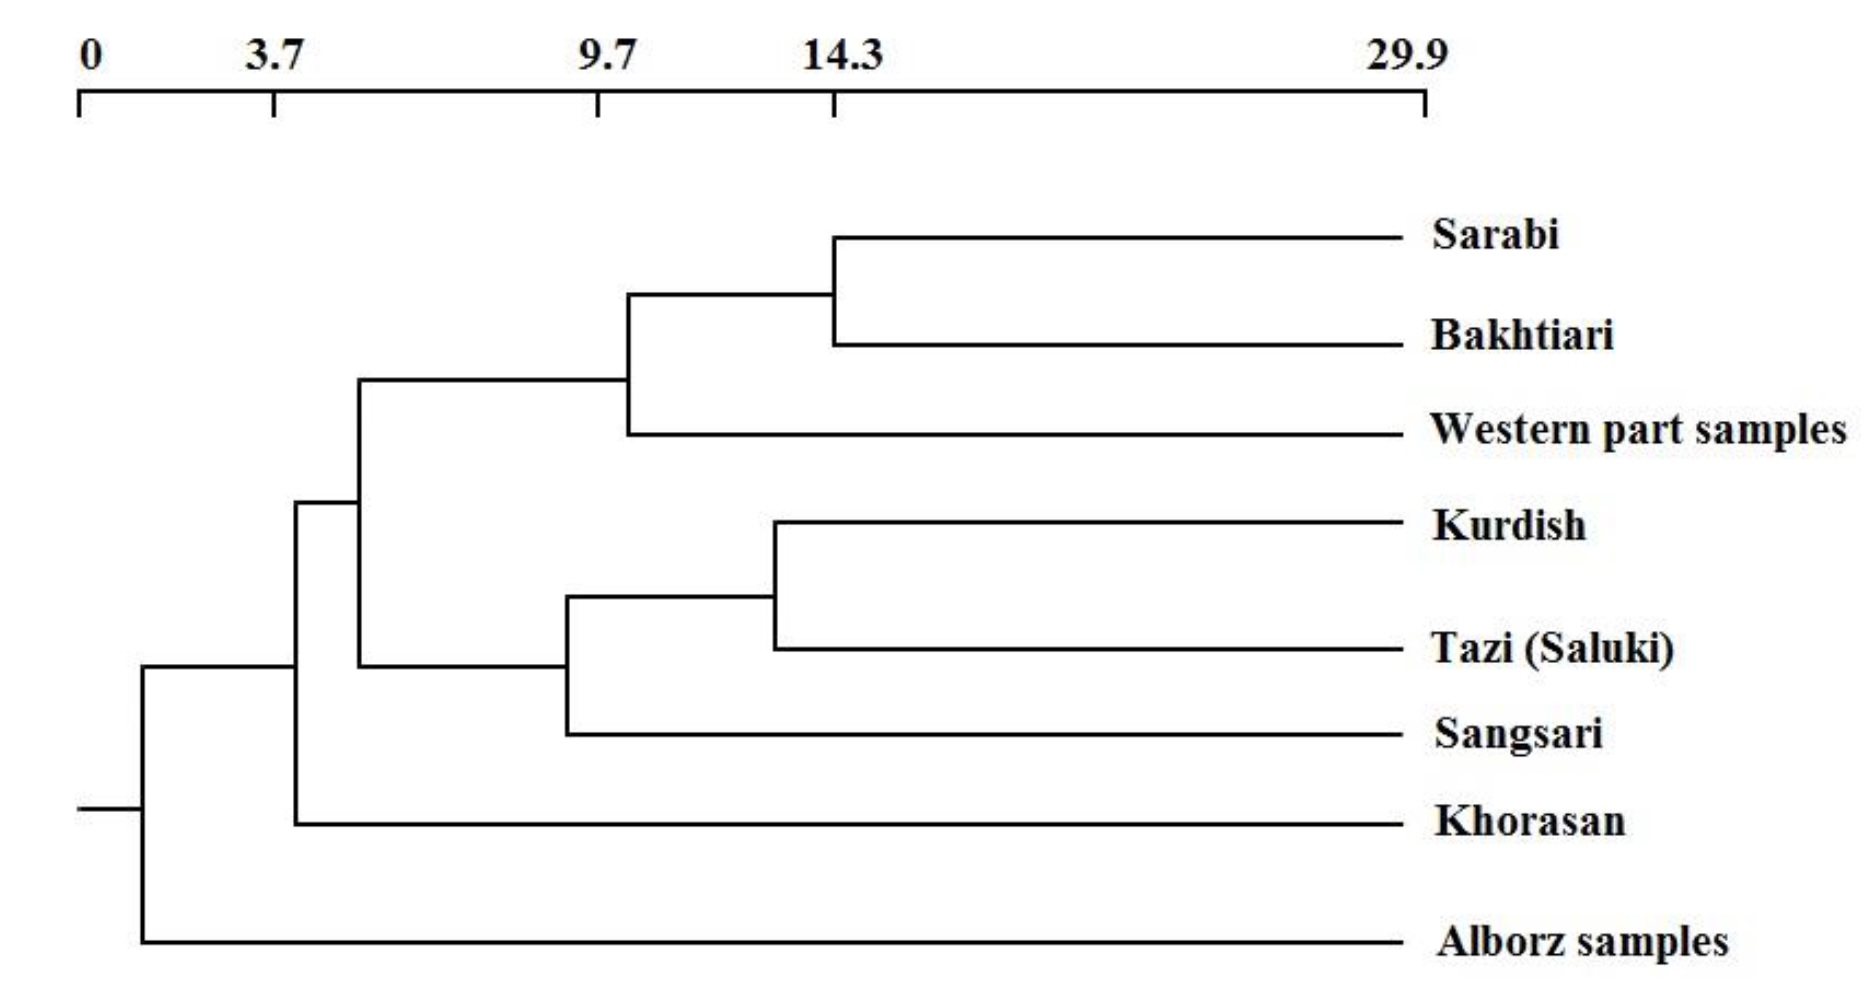
Figure 1. The genetic relationships among 8 populations of Iranian native dogs, based on the Nei’s distances. Values along the branches represent bootstrap support in percent from 1000 replications of resampled loci. The scale indicates genetic distance.
Table 4. The Nei’s genetic distance, mean FST estimates, and migrants per generation (Nm) values between each pair of 8 Iranian dog populations
|
Populations |
Sarabi |
Bakhtiari |
Alborz samples |
Kurdish |
Khorasan samples |
Western part samples |
Tazi (Saluki) |
Sangsari |
|
Sarabi |
- |
0.04 (5.17) |
0.08 (2.63) |
0.11 (2.02) |
0.06 (3.73) |
0.10 (2.19) |
0.08 (2.79) |
0.08 (2.73) |
|
Bakhtiari |
0.31 |
- |
0.06 (3.43) |
0.11(2.00) |
0.06 (3.89) |
0.11 (2.02) |
0.08 (2.82) |
0.09 (2.34) |
|
Alborz samples |
0.58 |
0.37 |
- |
0.10 (2.25) |
0.08 (2.76) |
0.13 (1.57) |
0.15 (1.50) |
0.14 (1.35) |
|
Kurdish |
0.35 |
0.44 |
0.55 |
- |
0.09 (2.47) |
0.12 (1.76) |
0.08 (2.78) |
0.13 (1.58) |
|
Khorasan samples |
0.58 |
0.5 |
0.61 |
0.80 |
- |
0.06 (3.66) |
0.06 (3.61) |
0.06 (3.83) |
|
Western part samples |
0.38 |
0.42 |
0.75 |
0.34 |
0.47 |
- |
0.09 (2.40) |
0.11 (1.99) |
|
Tazi (Saluki) |
0.42 |
0.62 |
0.85 |
0.33 |
0.62 |
0.53 |
- |
0.10 (2.17) |
|
Sangsari |
0.54 |
0.61 |
0.45 |
0.48 |
0.52 |
0.68 |
0.44 |
- |
Above the diagonal, FST values and Nm (between bracket) values; below the diagonal, genetic distance values are given.
Analysis of Y chromosome microsatellite markers in male animals
To analyze the locus-specific markers from the Y chromosome, four microsatellite loci were genotyped in 25 males from Iranian dog populations. All markers, except 650-79.3, were polymorphic, having two to four alleles. In a preliminary analysis of Y chromosome haplotype diversity among Iranian native dogs, 8 different haplotypes (A, B, C, D, E, F, G, and H) were found (Table 5). Haplotype F showed the highest frequency (7) among the haplotypes. Haplotypes C-D and haplotypes E-F differed only in the genotypes of the locus AF192268, and A-G differed only in the genotypes of the locus 650-79-4. Haplotypes B and H showed variation at loci AF192268 and 650-79.4. Haplotypes D and E were observed in Sarabi population but haplotype F was only found in Khorasan samples (Table 6). The number of haplotypes found per populations varied from 1 (Tazi) to 5 (Sarabi). The Tazi (Saluki) showed the lowest haplotype diversity.
Table 5. Y-chromosome microsatellite haplotypes found in the Iranian native dogs and allele sizes (bp) at four microsatellite loci
|
H |
G |
F |
E |
D |
C |
B |
A |
Haplotype Locus |
|
150 |
150 |
150 |
150 |
150 |
150 |
150 |
150 |
650-79.3 |
|
128 |
128 |
150 |
150 |
144 |
144 |
138 |
144 |
650-79.4 |
|
140 |
138 |
140 |
140 |
140 |
140 |
140 |
138 |
SRY |
|
218 |
212 |
212 |
218 |
218 |
212 |
212 |
212 |
AF192268 |
Table 6. Distribution of Y-chromosome microsatellite haplotypes across the male dogs
|
Total |
Western part samples |
Bakhtiari |
Khorasan samples |
Sarabi |
Tazi (Saluki) |
Population Haplotype |
|
6 |
- |
- |
- |
1 |
5 |
A |
|
2 |
- |
1 |
- |
1 |
- |
B |
|
2 |
- |
- |
1 |
1 |
- |
C |
|
1 |
- |
- |
- |
1 |
- |
D |
|
3 |
- |
- |
- |
3 |
- |
E |
|
7 |
- |
- |
7 |
- |
- |
F |
|
2 |
1 |
1 |
- |
- |
- |
G |
|
2 |
1 |
1 |
- |
- |
- |
H |
Discussion
Because of the gene flow among the dog populations, analyzing the genetic relationships of dog breeds could be difficult. Evaluation of frequency differences in microsatellite markers may be used for differentiation analysis of closely related species (Kim et al., 2001; Kang et al., 2009). In the current study, using the thirteen autosomal and four Y-linked microsatellite loci, the diversity, genetic structure and genotype distributions were analyzed in eight populations of Iranian native dogs.
All dog populations showed significant deviation from HWE. Genetic drift and division of the populations to smaller sub-populations over many generations is likely to cause changes in their genetic structure. In addition, lack of a control in exchange of genetic material in different areas, decreasing the number of native animals in each geographical region, uncontrolled mating and the limited number of samples could also affect the deviation of the populations from HWE. Deviation from HWE is being observed in some dog populations (Zajc et al., 1997; Kang et al., 2009; Kim et al., 2001). Moreover, grater genetic homogeneity and bottlenecks associated with catastrophic events such as war and economic depression could be observed in domestic dogs, which resulted in some deviations from HWE (Zajc et al., 1997). The microsatellite loci with 4–9 alleles per loci showed high variability in these populations. In the present study, six microsatellite markers (FH20609,20, REN144M10, REN86G15, REN126A15, FH2790 and C26.73320) showed high polymorphism in all populations indicating a great potential for parental testing and population-based genetic studies.
One of the most common criteria of molecular markers for the evaluation of the allelic diversity is heterozygosity. Our results indicated that the heterozygosities in these populations ranged from 0.53 (Sangsari) to 0.72 (Kurdish), indicating a strong contribution of different individuals in matings. The expected heterozygosities in the Iranian dog populations are similar to those of Asian dogs (0.54, Kishu; 0.69, Jindo; 0.59, Eskimo and 0.71, HAD) reported by Kim et al. (2001) and European dogs (0.52, English Setter; 0.65, Epagneal Breton and 0.55, German shepherd) reported by Parra et al. (2008), and Cho and Cho (2003). The Sangsari showed the lowest average allele number as well as the lowest heterozygosity, showing a considerable reduction in inter-population variation and extensive inbreeding. In addition, the low diversity in this population could be due to the reduction in the number of the dogs in its native region and the small sample size. High variation in Kurdish population might be related to the sampling of the animals from a vast geographical region in which they are spread. Gene flow, an evidence of gene exchanges between populations, has an important role in gene frequency changes within and between populations. The FST statistics and Nei’s genetic distance of the breed relationships and evolutionary studies are applied in comparing of the genetic values of the desirable animals. The highest genetic distance was observed between Tazi (Saluki) and Alborz samples (0.85) and Khorasan and Kurdish samples (0.80). It should be noted that the geographical locations of the animals are far from each other and migration among populations is less likely to have occurred. On the other hand, specific physical characters of these populations resulted in the reduction of the breeding between animals and consequently reduced the gene fusion between the populations. The dendrogram of the relationships between the samples showed a low genetic distance between Sarabi and Bakhtiari samples which is concordant with the evidences on the close relatedness of these two populations.
Autosomal microsatellite markers indicated a high genetic divergence in the Iranian native dogs (FST= 15%), which are similar to the Asian dogs (FST= 15.4%) reported by Kim et al. (2001), but lower than those reported by Parker et al. (2004) who analyzed 85 breeds of dogs and found a value of 27% for FST. However, the FST value in European dog breeds ranged from 0.099 (Jordana et al., 1992) to 0.108 (Morrena et al., 1999). The results might support the hypothesis of the origin of the dog from a single place in southeastern Asia in the Old World, and migration of some of the haplotypes to Europe or other parts of the world (Ardalan et al., 2011; Ding et al., 2012). During migration, a limited number of haplotypes succeed to pass the origins in the ancient world to reach Europe.
Subsequently, to understand the paternal lineages of the dog population in Iran, Y-chromosome microsatellite analysis was applied to available male animals. Although a small portion of the samples were male animals, 8 different haplotypes were observed. The results indicated that haplotype A in Tazi (Saluki) and Sarabi populations, haplotype B in Sarabi and Bakhtiari, haplotype C between Sarabi and Khorasan samples and haplotypes G and H in Western part and Bakhtiari populations were common, therefore, similar parental lineages are observed in Iranian dog populations. Y-chromosome common microsatellite haplotypes in Shepard and Border Collie also indicated a common origin for paternal lineages of these dogs during the past decades (Bannasch et al., 2005). Our data are in line with the data of Sundqvist et al. (2001) who detected 11 Y- chromosome microsatellite haplotypes in different dog breeds. The paternal lineages of the majority of Iranian dog populations likely originated from a vast number of males in the past; however, to confirm these findings, more samples must be assessed. The highest genetic diversity of Y chromosome was found in Sarabi ecotype. The exact reason for this high degree of diversity is not known, but the habitat of Sarabi dogs is adjacent to that of foreign dogs such as Ghafghazi dogs, which might have introduced some new paternal lineages into the population in the past. On the other hand, the Tazi (Saluki) ecotype showed only one Y-chromosome haplotype; the special features of the animal resulted in avoiding cross-mating with other dog populations. These animals had been kept for hunting by Iranian kings during the past centuries, which resulted in a special attention in treatment of Saluki dog.
Conclusions
Since the mutations in microsatellite loci usually occur through insertion or deletion of one or two repetitive units, it may be concluded that the difference in genetic diversity of the animals is a reflection of differences in genetic coverage. Although numbers of these populations have significantly decreased there is still enough genetic diversity for use in breeding programs and appropriate matting plans to preserve the populations. The existence of the remarkable genetic diversity in Iranian dog samples may be due to the location of Iran on Silk Road in the past. Transportation of animals through this road was usual and this animal because of its marked role in human societies and trades has been introduced to ancient Iran in past centuries. These findings, in addition to the partnership that exists between human and dog, and their migration could be helpful in determining human migration history in the Middle East.
Acknowledgements
The authors wish to thank the Research Center of Anti-Narcotics Police of Iran for supporting this project. Also we would like to thank Jalil Tavanay, Ebrahim Ghareghani and Damon Allahyar Khan Khorasany for their help in collecting the samples.
)