
Document Type : Research Article (Regular Paper)
Authors
1 Department of Animal Science, Faculty of Agriculture, Shahid Bahonar University of Kerman, Kerman, Iran.
2 Young Researchers Society, Shahid Bahonar University of Kerman, Kerman, PB 76169-133, Iran.
3 Department of Animal Science, Science and Research Branch, Islamic Azad University, Tehran, Iran.
4 State Key Laboratory of Genetic Resources and Evolution, Yunnan Laboratory of Molecular Biology of Domestic Animals, Kunming Institute of Zoology, Chinese Academy of Sciences, Kunming 650223, China.
Abstract
Keywords
Main Subjects
Introduction
Quantitative traits are influenced not only by several genes and their interactions but also by the surrounding environment. Identification of the genes which control economic traits is of great importance in agriculture. Since polymorphic DNA markers are available in many species, construction of well saturated genetic maps and genetic dissection of complex quantities traits are expected(Vallejo et al., 1998).
The simple way of scoring and high polymorphism are among the unique features which makes microsatellites one of the most popular molecular markers used in various fields(Zane et al., 2002) including molecular genetic evaluation and mapping of poultry chromosomes(Gholizadeh et al., 2007). Also, microsatellites are used for mapping locations within the genome, specifically in genetic linkage analysis and marker assisted selection to locate a gene or a mutation responsible for a given trait.
Knowledge of the Japanese quail (Coturnix japonica) genome paves the way in finding better solutions for increasing the efficiency of meat and egg production as sources of high quality protein for human nutrition. The quail’s 16-d embryonic developmental period, combined with its sexual maturation period of 8 weeks, results in generational times that are substantially shorter than those of the chicken (Huss et al., 2008). This useful feature makes the quail a suitable case to be genetically analyzed (Groenen et al., 1998).
Many studies have identified QTL for economically important traits such as growth and carcass traits in chickens (Van Kaam et al., 1999; McElroy et al., 2006; Uemoto et al., 2009). Some studies on the construction of linkage map using microsatellite markers has been conducted on quail(Kayang et al., 2000; Kayang et al., 2002). In 2004, a linkage map of quail using microsatellite markers was developed(Kayang et al., 2004). Minvielle et al. (2005) reported genome-wide significant or suggestive QTL for clutch length, body weight (5 and 70 weeks of age) and feed intake on chromosome 1, age at first egg and egg number on chromosome 6, and eggshell weight and residual feed intake on chromosome 20 in an F2 population of Japanese quail. Esmailizadeh et al. (2012) located significant QTL affecting body weight at 3, 4, 5 and 6 weeks of age, average daily gain, and Kleiber ratio, an indirect criterion for feed efficiency at 0–23 cM on chromosome 1 in a half-sib population of Japanese quail comprising of 300 birds from three half sib families. Sohrabi et al. (2012, 2014) also found locations of QTL underlying hatching weight and growth traits and estimated their additive and dominance effects on chromosome 1 in an F2 population. By using an F2 experimental population, Jabbari et al. (2014) also found similar results (by traits) on chromosome 3. Ahmadi et al. (2014), by construction of an F2 experimental population of Japanese quail, reported significant loci affecting breast weight and some other carcass parts weight on chromosome 5.
Since the poultry meat may be transported over long distances, the carcass has to be processed further to keep its quality. Slaughtering and dissection in sib tests make the detection of phenotypes on the relative yield of carcass parts difficult and costly. Detecting genomic regions, however, can facilitate genetic progress(Baron et al., 2011). Since none of the previous studies on detection of QTL affecting carcass traits in Japanese quail did not use half sib families, the objective of this study was to identify quantitative trait loci (QTL) affecting carcass traits on chromosome 1 in a half sib population of Japanese quail.
Materials and methods
Experimental population and phenotypic measurements
Parents were randomly selected from a commercial strain of Japanese quail. Nine unrelated males were randomly mated to 27 female birds to create a resource paternal half-sib mapping population consisting of 422 progeny (246 males and 176 females). The half-sib population was created in 5 consecutive hatches. The parents were kept in group cages and fed a layer diet ad libitum. The progeny from 9 sire families were raised for 5 weeks on a floor covered with wood shavings in an environmentally controlled room with continuous artificial lighting and at the temperature which was decreased gradually from 37 to 25˚C. The progeny received water, a mash starter diet (0–21 days), and a mash growing diet (22–35 days) ad libitum.
The F2 birds were slaughtered at 35 days of age and hot carcass weight, intestine weight, pancreas weight, liver weight, spleen weight, heart weight, pre-stomach weight, gizzard weight, testis weight, ovary weight, and head weight were recorded. The carcasses were kept at 4˚C for 24 h and, then, cold carcass weight, total carcass fat weight, uropygial gland weight, bursa of fabricius weight, femur weight, breast weight, neck weight, back weight, and wing weight were recorded. It should be noted that the trait measurement was performed by one person.
DNA samples, microsatellite markers, and genotyping
Blood samples of the 9 sires and their progeny were collected at slaughter using 2.5 mL blood collection tubes containing EDTA as the anticoagulant. Afterwards, they were kept at −20◦C. The genomic DNA was extracted from the whole blood using an optimized and modified salting-out method(Miller et al., 1988).
Eight microsatellite (GUJ0055, GUJ0052, GUJ0048, GUJ0013, GUJ0056, GUJ0098, GUJ0068, and GUJ0090) located on Japanese quail chromosome 1 were selected based on the polymorphism information content values of the loci(Kayang et al., 2002) and their positions(Kayang et al., 2004) and the 9 male birds and their offspring were genotyped for these markers.
Polymerase chain reaction (PCR) was performed for genotyping the 9 male birds and their progeny for each marker. The reactions consisted of 2 µL of template DNA (100 ng of genomic DNA), 2.5 µL PCR buffer (1 × PCR buffer), 1 µL MgCl2 (3.0 µM MgCl2), 0.5 µL dNTP mix (200 µM dNTP), 0.3 µL Taq DNA polymerase (1U), 1 µL (0.25 µM) of each forward and reverse primer, and 16.5 µL sterile water in the total volume of 25 µL. PCR amplifications were performed in 0.2 ml tubes using a 30 cycle program. The PCR procedure was performed at 4 min at 94৹C, followed by 30 cycles of 30 s at 94৹C, 1 min at annealing temperature (varying from 55-57৹C, depending on the marker being amplified) and 1 min at 72৹C, followed by a final extension step of 4 minutes at 72৹C. The PCR products were run on 8% denaturing polyacrylamide gels using electrophoresis. Individual PCR product fragment sizes for the microsatellite markers were determined by visualizing the band pattern via silver nitrate staining method.
Descriptive statistics and QTL mapping analysis
Basic descriptive statistics, including the number of observations (N), minimum values, maximum values, means, and residual standard deviation (RSD) were calculated using ASReml software(Gilmour et al., 2006) fitting a model including the mean of the half sib population for each trait, fixed effects of hatch (5 levels), and sex (2 levels) carcass weight as covariate and residual random term.
QTL analysis was conducted using the least squared regression interval mapping approach(Knott et al., 1996). QTL effects were estimated using 2 analyses for individual families and across families. For interval mapping, the following model was used:
yijkl = µi + aixij + Hk + Sl + eijkl
where yijkl is the observed phenotype of individual n, offspring of sire i; μi is the mean of sire family i; αi is the allele substitution effect of the QTL within family i; xij is the probability that animal n inherits the (arbitrarily assigned) first allele of sire i, given the observed marker genotypes and marker/QTL positions; Hk and Sl are the fixed effects of hatch (5 levels) and sex (2 levels), respectively, and eijkl is the residual random effect.
Applying the above-mentioned models, the F-statistic profiles were generated at 1 cM intervals along the chromosome to identify the most likely QTL position. Significance thresholds were determined empirically by permutation testing(Churchill and Doerge, 1994). Data permutation with 10,000 replicates was used to determine the empirical distribution of the test statistic under the null hypothesis of no QTL. QTL analysis was performed using GridQTL portal (Seaton et al., 2006).
Results and discussion
An example of visualized band patterns of the PCR products is represented in Figure 1. Descriptive analysis of all the studied traits was listed already by Charati et al. (2014). The effect of hatch was significant (P < 0.001) for all the traits, except for the uropygial gland weight. Effect of sex was significant for carcass weight (P < 0.001), back weight (P < 0.05), bursa of fabricius weight (P < 0.01), gizzard weight (P < 0.001), head weight (P < 0.001), pre-stomach weight (P < 0.05), spleen weight (P < 0.01), and wing weight (P < 0.01).
Table1. Distribution of the informative and uninformative progeny across the 9 half-sib Families
|
Family |
1 |
2 |
3 |
4 |
5 |
6 |
7 |
8 |
9 |
Sum |
|
Informative |
77 |
39 |
60 |
35 |
36 |
27 |
29 |
25 |
55 |
383 |
|
Uninformative |
1 |
13 |
1 |
1 |
0 |
12 |
3 |
7 |
1 |
39 |
|
Total |
78 |
52 |
61 |
36 |
36 |
39 |
32 |
32 |
56 |
422 |
The half-sib progeny was distributed across 5 hatches with on average 41 offspring ranging from 32 (sire families 7 and 8) to 78 (sire family 1) (Table 1).
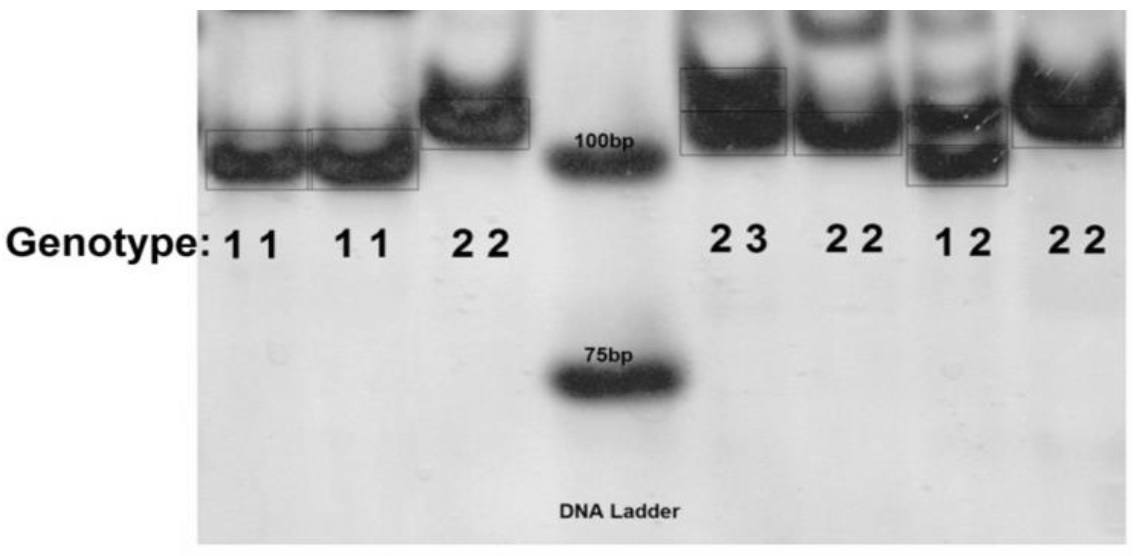
Figure 1. banding pattern of SSR markers on polyacrylamide gel
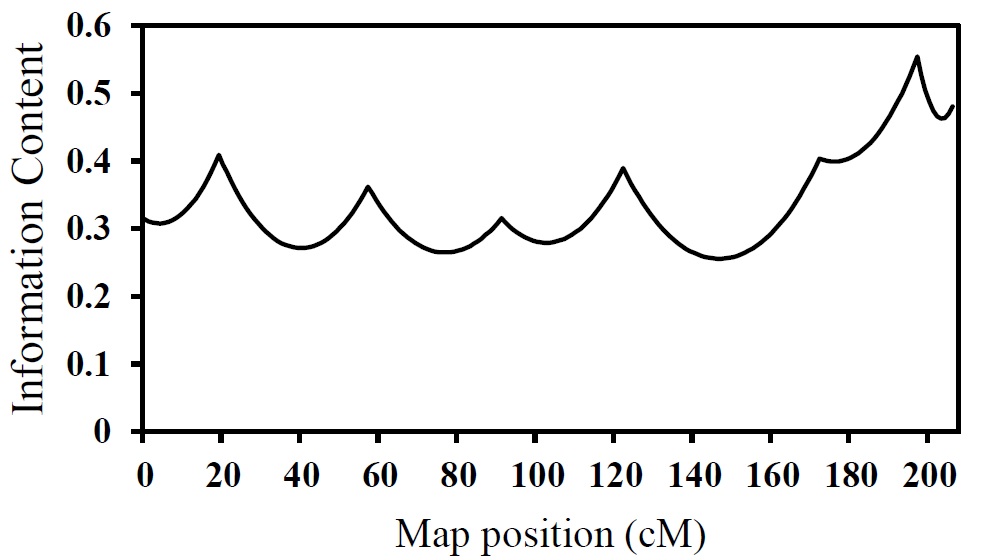
Figure 2. The useful information content (the PIC values) across chromosome 1 in 9 half-sib families of Japanese quail
Table 2. The useful information content of each marker
|
Marker |
Position (cM) |
Distance (cM) |
Genotyped individuals (%) |
Information |
Alleles |
|
|
Sires |
Half-sib progeny |
|||||
|
GUJ0055 |
0 |
0 |
9 (100%) |
402 (95%) |
0.31 |
3 |
|
GUJ0052 |
19 |
19 |
9 (100%) |
417 (98%) |
0.31 |
3 |
|
GUJ0048 |
57 |
38 |
9 (100%) |
407 (96%) |
0.36 |
2 |
|
GUJ0013 |
91 |
34 |
9 (100%) |
414 (98%) |
0.31 |
2 |
|
GUJ0056 |
122 |
31 |
9 (100%) |
401 (95%) |
0.39 |
2 |
|
GUJ0098 |
172 |
50 |
9 (100%) |
416 (98%) |
0.40 |
2 |
|
GUJ0068 |
197 |
25 |
9 (100%) |
407 (96%) |
0.56 |
2 |
|
GUJ0090 |
206 |
9 |
9 (100%) |
409 (96%) |
0.48 |
3 |
Information content was calculated at 1 cM intervals across all the investigated regions in the population for each analysis. The information content of an individual marker is the proportion of animals in which the allele inherited from the sire can be unambiguously identified (Table 2). Average information content across the 9 families and all of the investigated intervals along chromosome 1 (between and at the loci of the markers) was 0.39, ranging from 0.31 to 0.56 (Figure 2). The measure of information content can range from 0 (absence of information) to 1 (maximal information content). It should be noted that information content is less between markers than at the marker loci, as shown in Figure 2. The decrease in the information content can be due to the loss of informative markers in 1 or more families. In such a case, the relative genotype has been detected using the markers placed at farther distance(Knott et al., 1998). Factors such as the number of cases with no genotypes and the imbalance of allele segregation in markers can affect the amount of useful information gained by the markers(Esmailizadeh et al., 2008b).
The most likely position, F-statistic values, and allelic effects of detected QTL using individual family analysis for carcass traits are given in Table 3. In this analysis, the detected QTL was segregated in 7 out of 9 half-sib families and 17 chromosome-wide significant QTL was mapped for 11 traits through the scanning of chromosome 1. In total, 5 QTL were significant at 1% chromosome-wide level and 12 QTL were significant at 5% chromosome-wide level for 11 out of 17 traits evaluated in the half-sib population.
Individual family analysis in family 1 showed 4 chromosome-wide significant QTL underlying femur weight (P < 0.05), heart weight (P < 0.05), liver weight (P < 0.05), and uropygial gland weight (P < 0.05) at 61, 172, 122, and 123 cM of the linkage map, respectively. In family 2, two chromosome-wide significant QTL underlying bursa of fabricius weight (P < 0.05) and uropygial gland weight (P < 0.01) were found at 104 and 110 cM of the linkage map, respectively. In family 3, three chromosome-wide significant QTL underlying breast weight (P < 0.01), head weight (P < 0.01), and uropygial gland weight (P < 0.05) were found at 199, 171, and 206 cM of the linkage map, respectively. In family 4, two chromosome-wide significant QTL underlying breast weight (P < 0.01) and uropygial gland weight (P < 0.05) were found at 187 and 152 cM of the linkage map, respectively. In family 5, two chromosome-wide significant QTL underlying intestine weight (P < 0.05) and pancreas weight (P < 0.05) were found at 21 and 91 cM of the linkage map, respectively. In family 6, two chromosome-wide significant QTL underlying back weight (P < 0.05) and bursa of fabricius weight (P < 0.01) were found at 0 and 153 cM of the linkage map, respectively. There was no evidence for significant QTL for families 7 and 8. Finally, in family 9, two chromosome-wide significant QTL underlying breast weight (P < 0.05) and pre-stomach weight (P < 0.05) were found at 0 and 206 cM of the linkage map, respectively.
Size of the QTL effect ranged from 0.68 to 25.10 in the unit of the trait residual standard deviation for different traits. Maximum QTL effect was related to liver weight in family 9 and minimum QTL effect was associated with intestine weight in family 5. Given that a paternal half-sib design was used in this study, the estimated QTL effect in this design was an allele substitution effect, which marked the difference between parental Q and q alleles of the offspring and the effects of other genes on average between the two groups were assumed to be the same. It should be noted here that the allele substitution effect could also include dominance effect, because additive QTL effect was estimated as the mean difference between the 2 homozygous genotypes of QTL (QQ and qq). Simulation results showed that, when the number of progenies was low, size of the QTL effect was overestimated(Esmailizadeh et al., 2008a). Therefore, it is likely that, in the families with fewer offspring, the size of QTL effect would be overestimated.
Across family analysis showed 3 chromosome-wide significant QTL underlying bursa of fabricius weight (P < 0.05), breast weight (P < 0.05), and uropygial gland weight (P < 0.01), which were found at 24, 199, and 102 cM of the linkage map, respectively. The flanking marker locus to QTL for the bursa of fabricius weight was GUJ0052, for that of breast weight was GUJ0090, and the nearest marker to QTL for uropygial gland weight was GUJ0013. Table 4 shows the position of the significant QTL on the chromosome, the maximum F value obtained at each position, and the reduction of the residual variance obtained by fitting the QTL at the detected location (Figure 3).
Table 3. Summary of significant QTL from individual family analyses
|
Trait 1 |
Location (cM) |
Family |
Effect ± SE |
F- statistic |
F-statistic Threshold 2 |
Flanking marker |
|
|
P |
P |
||||||
|
FeW |
61 |
1 |
0.74 ± 0.23 |
9.9 * |
7.2 |
10.9 |
GUJ0048 |
|
HtW |
172 |
1 |
1.26 ± 0.45 |
7.9 * |
7.4 |
11.2 |
GUJ0098 |
|
LiW |
122 |
1 |
-0.68 ± 0.24 |
8.2 * |
7.4 |
10.9 |
GUJ0056 |
|
UGW |
123 |
1 |
0.70 ± 0.25 |
8.1 * |
7.3 |
10.8 |
GUJ0056 |
|
BFW |
104 |
2 |
-5.69 ± 1.85 |
9.5 * |
6.4 |
10.1 |
GUJ0013 |
|
UGW |
110 |
2 |
8.37 ± 2.15 |
15.2 ** |
6.7 |
10.9 |
GUJ0056 |
|
BrW |
199 |
3 |
-0.98 ± 0.26 |
13.7 ** |
6.9 |
10.8 |
GUJ0068 |
|
HdW |
171 |
3 |
1.26 ± 0.35 |
13.2 ** |
6.5 |
9.9 |
GUJ0098 |
|
UGW |
206 |
3 |
0.83 ± 0.31 |
7.3 * |
6.6 |
10.3 |
GUJ0090 |
|
BrW |
187 |
4 |
-2.39 ± 0.67 |
12.7 ** |
7.2 |
11.4 |
GUJ0068 |
|
UGW |
152 |
4 |
2.67 ± 0.80 |
11.1 * |
7.5 |
12.2 |
GUJ0098 |
|
InW |
21 |
5 |
25.10 ± 8.71 |
8.3 * |
8.1 |
13.0 |
GUJ0052 |
|
PaW |
91 |
5 |
-1.14 ± 0.39 |
8.7 * |
8.6 |
13.3 |
GUJ0013 |
|
BaW |
0 |
6 |
-15.37 ± 5.24 |
8.6 * |
6.6 |
10.4 |
GUJ0055 |
|
BFW |
153 |
6 |
-2.06 ± 0.54 |
14.8 ** |
6.5 |
10.3 |
GUJ0098 |
|
BrW |
0 |
9 |
-1.68 ± 0.55 |
9.3 * |
7.8 |
12.0 |
GUJ0055 |
|
PSW |
206 |
9 |
1.35 ± 0.42 |
10.6 * |
7.3 |
11.5 |
GUJ0090 |
1FeW: Femur weight, FeW: HtW: Heart weight, LiW: Liver weight, UGW: Uropygial gland weight, BFW: Bursa of fabricius weight, BrW: Breast weight, HdW: Head Weight, InW: Intestine weight, PaW: Pancreas weight, BaW: Back weight, PSW: Pre-stomach weight
2 Chromosome wide significance thresholds from permutation test
*,**; P < 0.05 and P < 0.01 chromosome-wide significant of QTL respectively
The proportion of the progeny phenotypic variation explained by the significant QTL ranged from 4.0 to 6.3%. The QTL variance shows the contribution of specific trait loci to the total phenotypic variance of the trait. In each position, mapping QTL using the desirable model determines whether a significant amount of the variance in a quantitative trait can be associated with the QTL in that position. QTL variance determined as the reduction of the residual variance acquired by fitting the QTL in the corresponding location was relatively small for the detected loci(Sohrabi et al., 2012). Considering the nature of the half-sib design used in the study, the effects were likely to be overestimated. Fairly large progeny group sizes were required to identify a medium-sized QTL in each half-sib group; otherwise, the experiment would either have low power to detect the QTL or the detected effect would be overestimated(Van der werf et al., 2007).
Table 4. Summary of significant QTL from across families’ analyses
|
Trait 1 |
Location (cM) |
V QTL 2 |
F-Statistics |
F-statistic Threshold 3 |
Flanking marker |
|
|
P |
P |
|||||
|
BFW |
24 |
6.2 |
2.4 * |
2.2 |
3.1 |
GUJ0052 |
|
BrW |
199 |
4.0 |
2.9 * |
2.5 |
3.5 |
GUJ0090 |
|
UGW |
102 |
6.3 |
4.2 ** |
2.8 |
3.5 |
GUJ0013 |
1BFW: Bursa of fabricius weight, BrW: Breast weight, UGW: Uropygial gland weight
2 QTL variance (the reduction in residual variance of the half sib population obtained by inclusion of a QTL at the given position)
3 Chromosome wide significance thresholds from permutation test
*,**; P < 0.05 and P < 0.01 chromosome-wide significant of QTL respectively
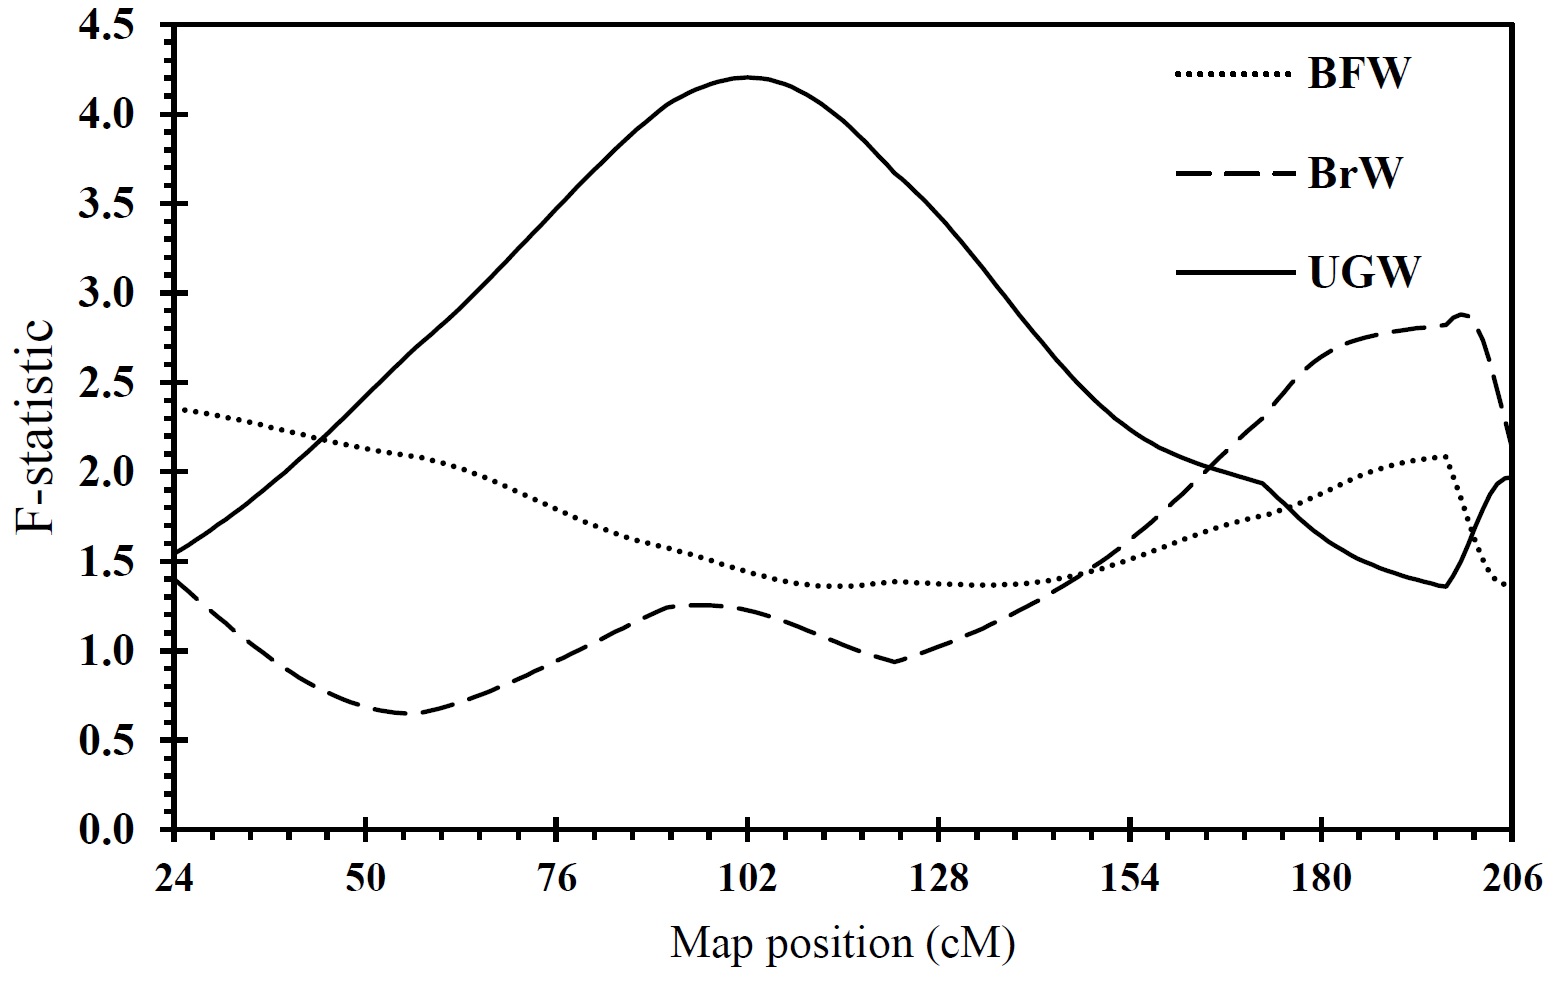
Figure 3. F-statistic curves resulted from the joint analysis of 9 half-sib families on chromosomes 1 of Japanese quail. The lower and upper horizontal lines represent 5 and 1% chromosome-wide significant levels of linkage, respectively. BFW: Bursa of fabricius weight, BrW: Breast weight, UGW: Uropygial gland weight
There are a large number of QTL studies that have identified QTL for carcass traits on chicken chromosome 1. As the chicken and quail are two species of animals belonging to the same family with identical karyotype (2n = 78), QTL for the traits identified in this study on chromosome 1 might be comparable with those reported in chicken(Kayang et al., 2006). Moradian et al. (2014) used an F2 population originated from two strains of Japanese quail to identify significant QTL for breast weight, carcass weight, carcass fatness, pre-stomach weight, and uropygial gland. In contrast, in the current study, due to the structure of available data, a half sib design was used. In this study, 3 significant QTL were detected from across family analyses on chromosome 1 in Japanese quail. Significant QTL affecting breast weight was found at 199 cM. Five QTL affecting breast weight at 92, 94, 128, 441, and 459 cM have been found in previous studies in chicken on chromosome 1(Ikeobi et al., 2004; Atzmon et al., 2006; Lagarrigue et al., 2006; Atzmon et al., 2008). Another significant QTL identified in this study was the bursa of fabricius weight QTL at 24 cM. In chicken, however, suggestive QTL affecting this trait was found on chromosomes 17 and 26 at 31 and 32 cM(Park et al., 2006). In this study, significant QTL underlying uropygial gland weight was detected at 102 cM, but there is no published QTL for this trait in chicken. It should be noted that, due to the marker-poor linkage map in Japanese quail compared with the marker-rich linkage map in the chicken, the positions of the identified QTL for these traits on Japanese quail chromosome 1 might not be comparable to those of the detected QTL on chromosome 1 in chicken.
The current study found significant QTL for a number of internal organs which have not been subjected in previous studies. The development of internal organs, supposed to be coordinated with the development of the whole body (Zhang et al., 2007; Esmailizadeh and Mohammadabadi, 2010), reflects body structure which may influence the productive potential. As a result, investigation on QTL mapping of the weights of the internal organs would be helpful in understanding the genetic basis of internal organ development and this will benefit understanding of the genetic background of internal organ growth in Japanese quail in particular and the birds in general(Zhang et al., 2007).
Results of this study point out to candidate regions affecting traits of economic relevance to the Japanese quail breeding. The comparative analysis concerning the location of QTL on different Japanese quail and the syntenic chicken chromosomes, in combination with their association with phenotype can expand our ability to understand the genetic complexity of economically important traits in Japanese quail. Isolation of additional microsatellites, single nucleotide polymorphisms (SNPs), and microsatellites in ESTs and genes are required to allow for the construction of a high resolution linkage map for fine mapping of the detected QTL and discovering new potential genes of interest.
)