
Document Type : Research Article (Regular Paper)
Author
Department of Animal Science, Faculty of Agricultural, Shahid Bahonar University of Kerman, Kerman, Iran.
Abstract
Keywords
Main Subjects
Introduction
Some production traits such as milk yield are expressed on multiple occasions in a cow’s lifetime. These expressions are assumed as one character expressed across different lactations. Generally repeatability model has been utilized for genetic analysis of the repeated records. In this model a unity genetic correlations is assumed among the repeated records. The phenotypic variance is divided into three components including direct additive genetic variance, animal permanent environmental variance and residual variance. The variances are assumed to be homogenous while they can be changed across the lactations. Zeynadidni et al. (2014) showed the genetic variance of milk yield is changed across different lactations. Previous studies showed that for genetic analysis of the repeated records, appropriate co (variance) structure can be fitted using pre-structured multivariate models (Asadi Fozi et al., 2013 and Coelli et al., 1998). In the models the co (variance) structure are modelled based on physiological knowledge about the traits investigated. Asadi Fozi et al. (2013) reported that in comparison with the pre-structured models, repeatability model is not an appropriate model for genetic analysis of fibre diameter in merino sheep. They showed thatthe genetic variance of fibre diameter increased up to 3rd shearing but it doesn’t change for the later ages while repeatability model allowed no changes in fibre diameter measured at different shearings.Residual and genetic (co) varianceamong the lactations were modelled for more accurate genetic analysis of lifetime milk yield in Iranian Holstein cows (Zeynadidni., 2014). Accordingly, a pre-structured multivariate model was the best model for the genetic analysis. Zhiying et al. (2014) found that a pre-structured multivariate model was the most parsimonious model for genetic analysis of fleece traits in Inner Mongolia Cashmere goats.
The aim of this study was to compare the efficiency of the repeatability model and the pre-structure multivariate model for genetic analysis of milk yield in five different lactations of the Iranian Holstein cows where the residual co (variance) and genetic variance were modelled but genetic co (variance) among the lactations was assumed to be homogenous for all the models applied.
Materials and methods
Data
The data were collected by the Iranian Animal Breeding Centre. A total of 313,006 milk yield (M) records were measured on 116,531cows born between 2001 and 2005 that descended from 2,355 sires and 91,212 dams. Of those, 116,531,83,731,57,094,35,961 and 19,689 records were collected at 1st (M1), 2nd (M2), 3rd (M3), 4th (M4) and 5th (M5) lactations, respectively. The records were adjusted based on 305 days and twice milking per day (2X). The data were collected from 23 provinces in Iran. The data characteristics are presented in Table 1.
Table 1.Simple statistics and data structure for 305-d milk yield measured at first, second, third, fourth and fifth lactations of Iranian Holstein cows
|
Statistics |
M1 |
M2 |
M3 |
M4 |
M5 |
|
Mean (kg) |
7964 |
8892 |
9267 |
9245 |
9082 |
|
SD (kg) |
1559 |
1924 |
2074 |
2133 |
2134 |
|
Number of records |
116531 |
83731 |
57094 |
35961 |
19689 |
|
% of animal with records |
100 |
72 |
49 |
31 |
17 |
|
Number of sires |
2355 |
2200 |
2029 |
1805 |
1542 |
|
% of sires |
100 |
93 |
86 |
77 |
65 |
|
Number of dams |
91212 |
69106 |
49469 |
32530 |
18455 |
|
% of dams |
100 |
76 |
54 |
36 |
20 |
|
NMGSb |
2071 |
1122 |
1018 |
877 |
668 |
|
NDc |
22044 |
16027 |
11019 |
7225 |
3693 |
|
ANPd |
1.28 |
1.21 |
1.15 |
1.11 |
1.07 |
aPercentage of animal with records, bNumber of maternal grand sires, cNumber of dams with records, dAverage number of progeny records per dam
Genetic analysis
In repeatability model, unity genetic correlations and homogenous variances are assumed among the repeated records (Falconer, 1996). To evaluate the efficiency of this model for genetic analysis of repeated records, the residual co (variance) and the genetic variance structures were modelled using a series of pre-structured multivariate models. The milk yields records were assumed as one character expressed across the lactations, and then unity genetic correlations were considered between the lactations. Accordingly, in the pre-structured multivariate models (the same as repeatability model) the genetic correlations were assumed to be one where homogenous genetic covariance was fitted. The assumption of the unity genetic correlations among the lactations can be investigated in future studies.
Repeatability model (Model 1)
In this model, herd-year-season, birth year, state and animal age at calving were fitted as the fixed effects. Linear, quadratic and higher orders of regression were tested for the effect of age. The animal genetic effects and the animal permanent environmental effect were the random effects. The model was as follows:
[A]
where, y is a vector of animal repeated records, b is a vector of fixed effects, a is a vector of additive genetic effects; pe is a vector of animal permanent environmental effects, and e is a vector of residual effects. X is the incidence matrix for the fixed effects and Z1 and Z2, are incidence matrices relating observations to random animal effectsand animal permanent environmental effects, respectively.
Pre-structured multivariate models (model 2, 3, 4, 5 and 6)
For each lactation a univariate analysis was used with an animal model including all significant fixed effects and direct additive genetic effect of the animals. The model was as follows:
[B]
where, y is a vector of milk yield records measured at each lactation, b is a vector of fixed effects, a is a vector of additive genetic effects, and e is a vector of residual effects. X is the incidence matrix for the fixed effects and Zis incidence matrix relating observations to random animal effects.
The univariate model [B] was also used for multivariate analysis but was expanded as where yi represents milk yield measured at the ith lactation. Similarly, b consisted of significant fixed effects resulting from univariate analysis with b partitioned according to fixed effects for each lactation anda can be partitioned into the respective effects referring to each lactation.
The pre-structured multivariate models were fitted with varying genetic variance structures from uniform to unstructured with a unity genetic correlation. In these models,in contrast with the repeatability model, a heterogeneous residual (co)variance structure with 15 parameters was considered.
Homogenous genetic variance was assumed for the milk yield records (Model 2). In Model 3, the genetic variance of first lactation was distinguished from the other lactations and hence the genetic variance of the different lactations was divided into two different groups, first lactation and the later lactations consisting of 2nd, 3rd, 4th and 5th lactations. Model 4 was fitted when the genetic variances of milk yield measured at first and second lactations were separated from the later lactations. In Model 5 the genetic variance of the milk yieldswas partitioned into 4 different groups as 1st lactation, 2nd lactation, 3rd lactation and the later lactations including lactation 4 and lactation 5. Finally, a complete heterogeneous genetic variance structure was assumed for the milk yields in model 6.Variance components and genetic parameters were estimated using ASReml (Gilmour et al., 2002).
The log likelihood ratio test can be used to compare different models, but it tends to favour models with a higher number of parameters (Albuquerque and Meyer, 2001). Akaike’s Information Criterion (AIC) and Schwarz’s Bayesian Information Criterion (BIC) (Wolfinger, 1993) penalize the log likelihood for the number of estimated parameters.
Albuquerque and Meyer (2001) suggested that BIC involves a more stringent penalty for the number of parameters used and is therefore more efficient to select the most parsimonious model. Therefore, in this research, BIC was used as the model selection criterion.
Results
The results of the model comparison are presented in Table 2. Among the repeatability and pre-structured multivariate models, model 6 had the lowest BIC. Repeatability model is used for genetic analysis of repeated records. Therefore, the results derived from the best model (model 6) and the repeatability models are presented.
Table 2. Number of parameters estimated (np), log likelihood values (Log L), and Bayesian Information Criterion (BIC) for the models used
|
Model |
Description |
np |
Log L |
BIC |
|
1 |
Repeatability |
3 |
-5151 |
10318 |
|
2 |
Homogenous genetic variance |
16 |
-4517 |
9121 |
|
3 |
2 genetic variance structures |
17 |
-4515 |
9122 |
|
4 |
3 genetic variance structures |
18 |
-4507 |
9112 |
|
5 |
4 genetic variance structures |
19 |
-4496 |
9096 |
|
6 |
Heterogeneous genetic variance |
20 |
-4487 |
9082 |
The trend in additive genetic and residual variance of milk yield measured at 1st, 2nd, 3rd, 4th and 5th lactations using the best model (model 6) and the repeatability model were shown in Figure 1. A value of 461,000kg2was estimated for the animal permanent environmental variance of the milk yield when repeatability model was applied. This value was presented separately as it was only estimated by the repeatability model.
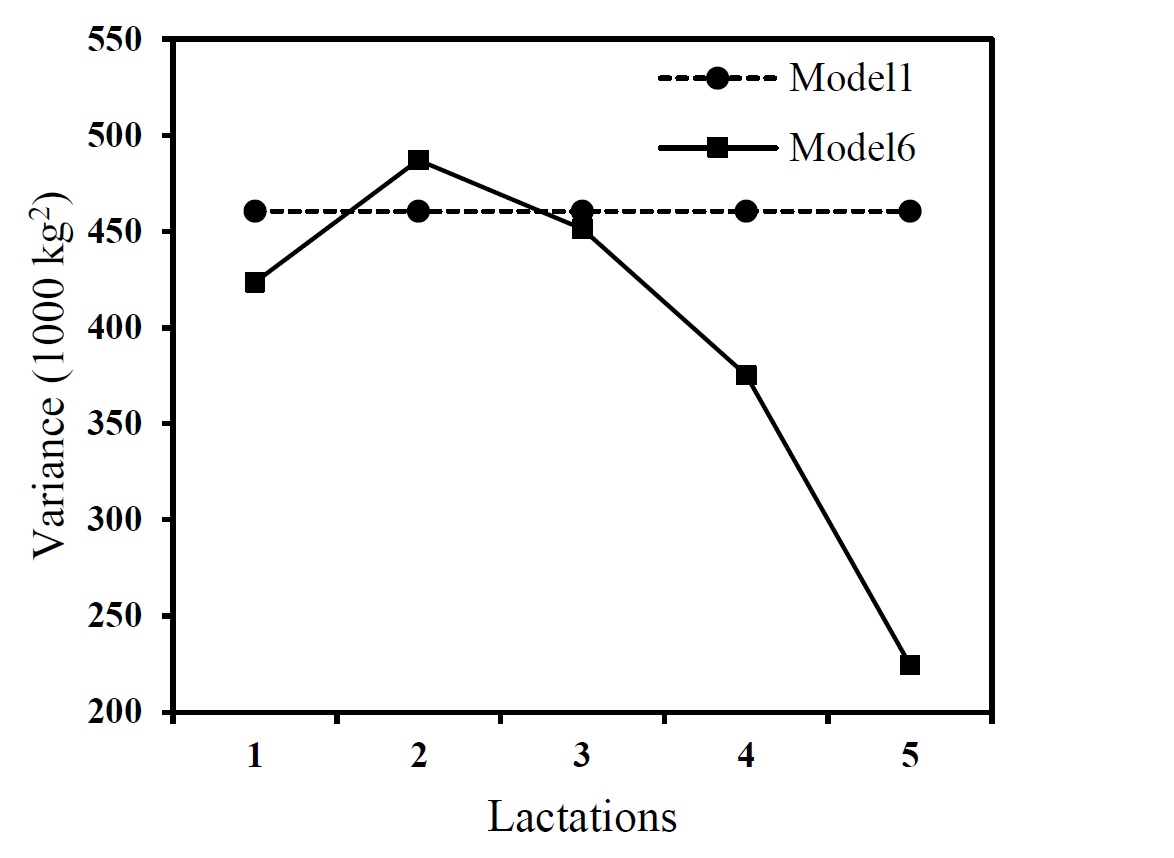
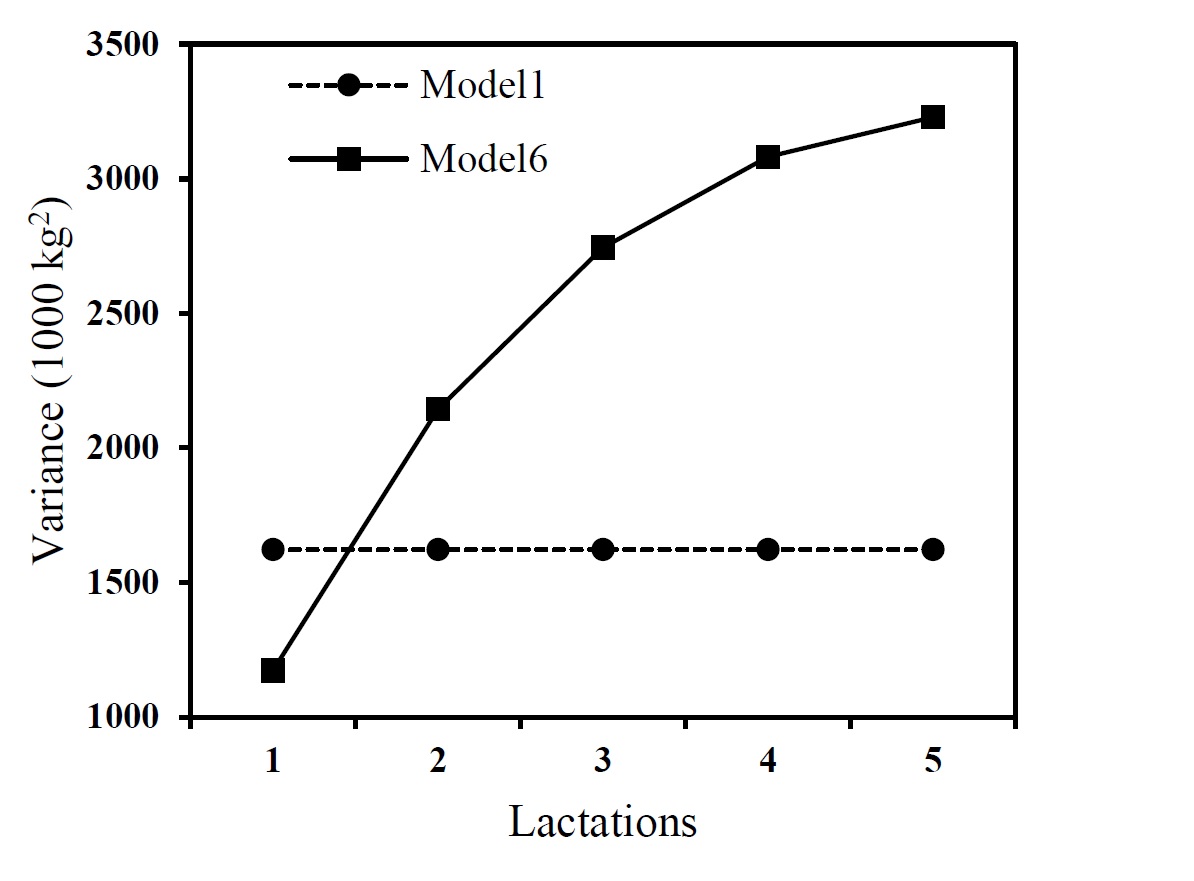
Figure 1. Estimates of the additive genetic variance (left) and residual variance (right) of milk yield at different lactations using repeatability (Model 1) and pre-structured multivariate (Model 6) models
The estimates of heritability and genetic and phenotypic correlations of the milk yield measured at first, second, third, fourth and fifth lactations derived from the most parsimonious model (Model 6) are shown in Table 3. Accordingly, genetic correlations between the milk yield were unity. A range of 0.27 to 0.48 was found for the phenotypic correlations. Based on assumptions of repeatability model, genetic and phenotypic correlations among the milk yields were considered to be unity where this model was applied.
Table 3. Estimates of heritabilities (on diagonal), phenotypic correlations above diagonal and genetic correlations below diagonal for milk yield measured at first (M1), second (M2), third (M3), fourth (M4) and fifth (M5) lactations using the most parsimonious model (Model 6)
|
Trait |
M1 |
M2 |
M3 |
M4 |
M5 |
|
M1 |
0.27 |
0.47 |
0.39 |
0.32 |
0.27 |
|
M2 |
1 |
0.19 |
0.46 |
0.40 |
0.34 |
|
M3 |
1 |
1 |
0.14 |
0.47 |
0.41 |
|
M4 |
1 |
1 |
1 |
0.11 |
0.48 |
|
M5 |
1 |
1 |
1 |
1 |
0.07 |
The heritability of the milk yields was estimated using the respective variance components. The estimates of heritability for the milk yields were between 0.07 to 0.27 using the best model. Values of 0.18 and 0.36 were derived from repeatability model for heritability and repeatability of the milk yields, respectively. The trends in the heritabilities estimated by the preferred model (model 6) and the repeatability model are presented in Figure 2.
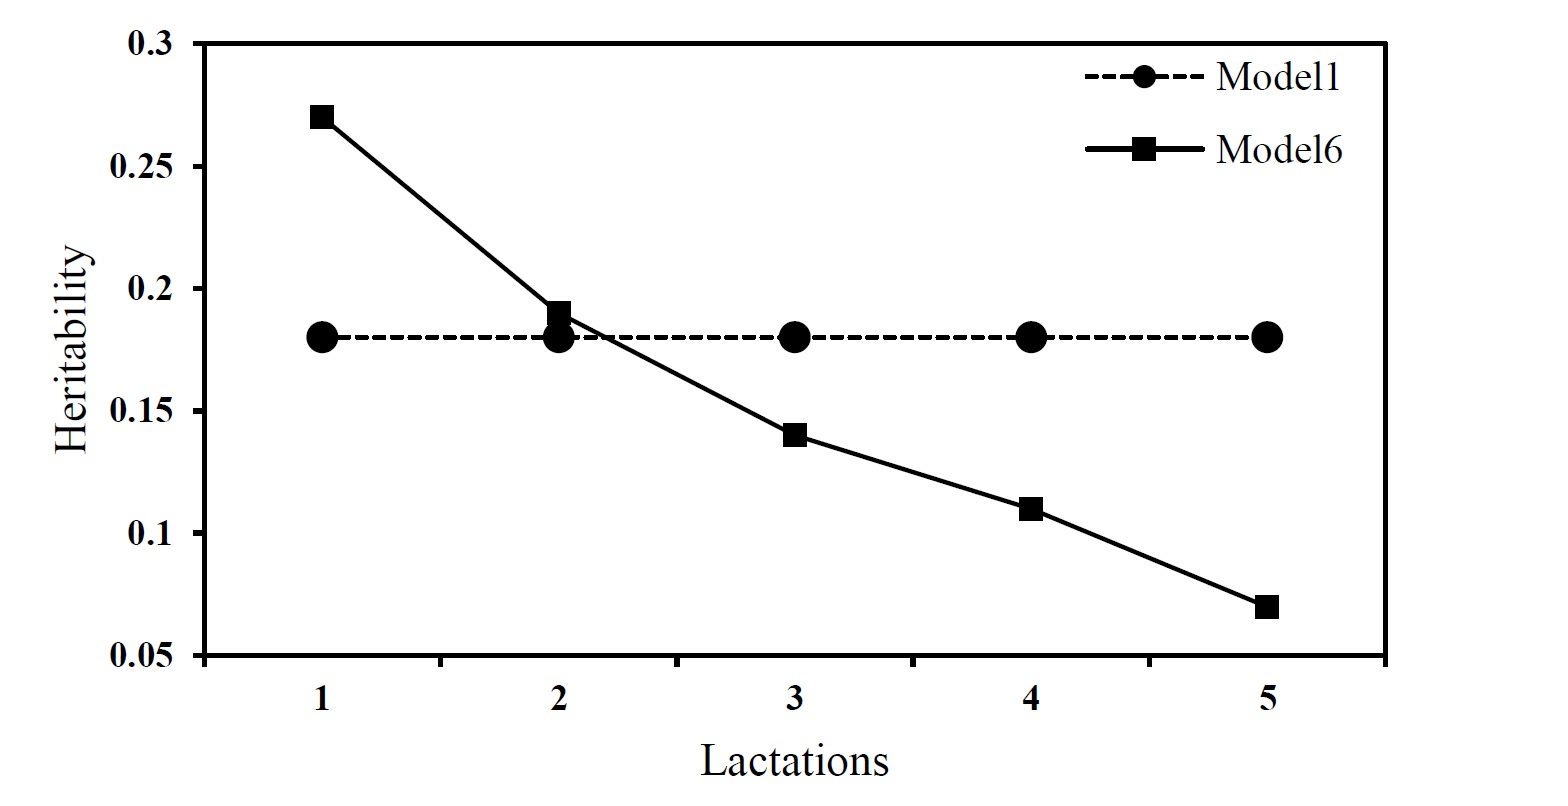
Figure 2. Estimates of the heritability of milk yield at different lactations using repeatability (Model 1) and pre-structured multivariate (Model 6) models
Discussion
The mean of milk yield increased sharply from 1st to 3rd lactations, and then decreased slightly for the later lactations.The results of the model comparison showed that the repeatability model (Model 1) was the worst fit to the data (Table 2). A smaller value was found for BIC when Model 2 was fitted. Therefore, heterogeneous structure is more appropriate for the residual co (variance) than the homogenous structure that is considered in Model 1 (the repeatability model). Fitting a model where the genetic variance of first lactation was distinguished from the other lactations (Model 3), did not improve the previous models significantly.Better results were obtained when the genetic variance of milk yield taken at second lactation as well as first lactation was separated from the later lactations(Model 4). An improvement was found when Model 5 was fitted. This model improved when a complete heterogeneous genetic variance (Model 6) was considered.
Comparison of the models indicated that a pre-structured multivariate model that is model 6 was the best model for genetic analysis of the data, as it had the lowest BIC value (Table 2). Asadi Fozi et al. (2012) showed that pre-structured multivariate models are more appropriate than the repeatability model for genetic analysis of mean fibre diameter in fine and medium wool Merino sheep. Coelli et al. (1998) reported modelling (co)variance structure across ages for wool traits in medium wool Merino sheep using autoregressive, banded and a series of other pre-structured multivariate models. They found a banded correlation as the best multivariate model for (co) variance structure of ages of mean fibre diameter.A pre-structured multivariate model was the best model for lifetime genetic analysis of milk yield in Iranian Holstein cows where a series of pre-structured multivariate model and repeatability model were fitted (Zeynadini et al., 2014).In the previous studies, heterogeneous genetic co (variance) structure was used while in the current study homogeneous genetic co (variance) was considered.
No similar previous studies were found to be discussed and compared with the present results. Therefore in the following paragraphs, the results of the pre-structured multivariate model (Model 6) will be discussed and then compared with the repeatability model.
The results of the best model show that the additive genetic variance increased from 1st lactation to 2nd lactation, while for the later ages the additive genetic variance was decreased. A homogenous genetic variance was estimated for the milk yield measured at the different lactations using repeatability model as the model allowed no change (Figure 1).The residual variance increased from 1st to 5th lactations when the best model was applied while the same values were derived from the repeatability model for the residual variance during the lactations (Figure 1).
The trends in heritability of milk yields measured at different lactations are shown in Figure 2. The results of the best model (model 6) show the heritability of the milk yield reduced from 1st lactation to 5th location where a value of 0.27 was found for heritability of milk yield at first lactation. This value reduced to 0.19, 0.14, 0.11 and 0.07 in 2nd, 3rd, 4thand 5th lactations, respectively. The deceasing in heritability is due to increasing residual variance from 1st to 5th lactation while the genetic variance was slightly increased from 1st to 2nd lactation and then decreased for the later lactations. The same values (0.18) were estimated for the heritability of milk yield measured at the different lactations using the repeatability model, because homogenous genetic and residual variances were assumed and estimated for this model.
In this study, the milk yields were assumed as one character expressed across the different lactations. Then for both repeatability and the best model, unity genetic correlations were assumed among the repeated records. In repeatability model, phenotypic correlation among the repeated records was also assumed to be unity while moderate to high values (0.27 to 0.48) were estimated for the phenotypic correlations using the preferred model (Model 6) (Table 3). The lowest correlation (0.27) was found between milk yield measured at first and fifth lactations and the highest value (0.48) was between fourth and fifth lactations. The results clearly indicate that the phenotypic correlations become weaker as the age difference increased.
Conclusions
Repeatability and unstructured multivariate models are widely used for genetic analysis of repeated observations while in this study a pre-structured multivariate model was chosen as the best approach according to the Schwarz’s Bayesian Information Criterion (BIC). The results of the best model showed that heterogeneous residual co (variance) and genetic variance gave a better fit to the data where the heritability of the milk yields and phenotypic correlations among the milk yields were changed during different lactations while repeatability model allowed no changes in the heritability and assumed a unity phenotypic correlation, because homogenous structures were fitted for the co (variances) in this model. Consequently, lifetime milk yield may not be accurately analyzed based on repeatability model. In the current study a homogenous genetic covariance was considered among the milk yields which can be appropriately modelled in future studies.
Acknowledgments
We are grateful to the Iranian Animal Breeding Center for providing us the data.
)